MLB UPDATED SUPPLEMENT
to
The Report of the Independent
Members of the Commissioner’s
Blue Ribbon Panel on Baseball Economics
December 2001

to
The Report of the Independent
Members of the Commissioner’s
Blue Ribbon Panel on Baseball Economics
December 2001
Table of Contents
II. The
Blue Ribbon Panel on Baseball Economics 2
III. Blue
Ribbon Panel’s Findings and Conclusions 3
IV. Overview
of Updated Data 7
V. Updated
Data and Analysis 11
A.
Average
Payroll and Postseason Performance 11
Table
1 11
B.
Industry
Revenues 12
Table
2 12
C.
Local Revenues 14
Table
3 14
Chart
2 15
Chart
3 16
D.
Central Fund
Revenues 17
Table
6 17
E.
Club Payrolls 18
Table
7 18
F.
Club
Competitiveness 19
Chart
12 19
G.
Club
Profitability 20
Chart
1 20
Table
30 21
Chart
14 22
H.
Club
(Industry) Debt 23
Chart
17 23
VI. Appendix
A—Detailed Data 24
Table
27 24
Table
28 25
Table
29 26
VII. Appendix
B—Definitions 27
The staff of Major League Baseball (MLB), at
the direction of the Commissioner, has prepared this Supplement to update The
Report of the Independent Members of the Commissioner’s Blue Ribbon Panel on
Baseball Economics, which was released in July, 2000. The purpose of this document is to bring up to date the economic
information that was examined by the Blue Ribbon Panel, which covered the
1995-1999 baseball seasons. Comparable
data for the 2000 and 2001 seasons has been included in a number of updated
tables and charts that now cover the period 1995-2001.
The organizational format for presenting
data is the same used in The Report of the Independent Members. There are some small differences in data for
the 1995-1999 seasons from those published in their July, 2000 Report,
reflecting corrections made after further verification of data by the
accounting firm Ernst and Young. None
of the adjustments are of an order of magnitude that would reasonably alter the
conclusions or recommendations of the Independent Members. Every effort has been made to ensure that
the data in this Supplement are as complete, up-to-date and accurate as
possible.
A number of the findings, observations and
conclusions of the Blue Ribbon Panel have been excerpted from The Report of the
Independent Members and recounted here verbatim—albeit in condensed, summary
form—in order to provide context for the updated supporting data. This Supplement adheres closely to the analytical
framework of The Report of the Independent Members, and where possible uses the
precise language of the Independent Members to explain the data that have now
been updated to cover the extended period since their Report was released.
It should be emphasized, however, that the
new text labeled “Update” in the Overview of Updated Data and accompanying the
updated tables and charts in the Updated Data and Analysis section has been
provided by the MLB staff, not by the Independent Members who authored the
July, 2000 Report. Any observations and
opinions the individual Independent Members may have with respect to the
updated data or explanatory text should properly come from them. MLB does not intend to imply that the Blue
Ribbon Panel has met to update or revise The Report of the Independent Members
released in July, 2000 or that the Independent Members in any way authored,
endorsed or reviewed this Supplement.
At
the direction of the Commissioner or the Independent Members, MLB may
periodically expand this Supplement or publish additional updates of
information in The Report of the Independent Members.
II. The Blue Ribbon Panel on Baseball Economics
The Commissioner’s Blue Ribbon Panel on
Baseball Economics was formed to study whether revenue disparities among clubs
are seriously damaging competitive balance, and, if so, to recommend structural
reforms to ameliorate the problem.
Specifically, the Independent Members were
charged with studying the economic condition of the game and producing a report
addressing the relationship between MLB’s current economic structure and
competitive balance, and the ramifications of the current economic system for
the future growth, health, stability and competitive balance of Major League
Baseball.
The Blue Ribbon Panel analyzed data provided
by MLB for the years 1995-1999. Data
included information about each club’s regular-season and post-season won-loss
record, ticket and concession prices, local revenues, Central Fund revenues,
player payrolls, revenue sharing payments/receipts, profits and losses,
industry debt and franchise values.
Data were verified by the accounting firm Ernst and Young through 1998.
The Independent Members of the panel
were: Richard C. Levin, professor of
economics and President of Yale University;
former United States Senator George J. Mitchell; Paul Volcker, former Chairman of the Board
of Governors of the Federal Reserve System;
and George F. Will, political columnist and commentator who has written
extensively about baseball. Representatives
of 12 MLB clubs also participated on the Panel.
(Note:
The Mission Statement of the Blue Ribbon Panel and a complete listing of
the Independent Members and the Club Representatives can be found on pages
53-54 of The Report of the Independent Members. Biographies of the Independent Members can be found on pages
55-57. Definitions of Local Revenue,
Central Fund Revenue, and Payroll, and the formulas used for calculating
revenue sharing payments/receipts, can be found on page 59 of the Report.)
After more than 18 months of considering
voluminous data on the economic condition of the game, the Independent Members
released a detailed, 87-page report in July, 2000. Their summary conclusions were as follows:
a.
Large
and growing revenue disparities exist and are causing problems of chronic competitive imbalance.
b.
These
problems have become substantially worse during the five complete seasons since the strike-shortened
season of 1994, and seem likely to remain severe unless Major League Baseball
undertakes remedial actions proportional to the problem.
c.
The limited
revenue sharing and payroll tax that were approved as part of MLB’s 1996
Collective Bargaining Agreement with the Major League Baseball Players Association
(MLBPA) have produced neither the intended moderating of payroll disparities
nor improved competitive balance.
Some low-revenue clubs, believing the amount of their proceeds from
revenue sharing insufficient to enable them to become competitive, used those
proceeds to become modestly profitable.
d.
In a majority
of MLB markets, the cost to clubs of trying to be competitive is causing escalation
of ticket and concession prices, jeopardizing MLB’s traditional
position as the affordable family spectator sport.
The Independent Members reached other
findings and conclusions, including, among others, these:
1.
“Measured
simply in terms of gross revenues, which almost doubled during the five
complete seasons (1995-1999) since 1994, MLB is prospering. But that simple measurement is a highly
inadequate gauge of MLB’s economic health.
Because of anachronistic aspects of MLB’s economic structure, the
prosperity of some clubs is having perverse effects that pose a threat to the
game’s long-term vitality.”
2.
“Widening
revenue disparities have been accompanied by widening payroll disparities….Not
surprisingly, there is a strong correlation between high player payrolls and
success on the field. Although a high
payroll is not always sufficient to produce a club capable of reaching
postseason play—there are numerous instances of competitive failures by
high-payroll clubs—a high payroll has become an increasingly necessary
ingredient of on-field success.”
3.
“In the
context of baseball, proper competitive balance should be understood to exist
when there are no clubs chronically weak because of MLB’s structural
features. Proper competitive balance
will not exist until every well-run club has a regularly recurring reasonable
hope of reaching postseason play.”
4.
“Granted,
competitive balance as here defined has been an elusive goal, when it has been
a goal at all, throughout MLB’s history.
However, the fact that baseball’s structural flaws are historic is not
an argument for continuing acceptance of them.
This is particularly so when they are producing revenue disparities with
unhealthy consequences for competitive balance.”
5.
“What has made
baseball’s recent seasons disturbing, and what makes its current economic
structure untenable in the long run, is that, year after year, too many clubs
know in spring training that they have no realistic prospect of reaching
postseason play. Too many clubs in
low-revenue markets can only expect to compete for postseason berths if
ownership is willing to incur staggering operating losses to subsidize a
competitive player payroll.”
6.
“Furthermore,
baseball fans are not, and should not be asked to be, as stoical about
competitive imbalance as they have been in the past. Competition for the sports entertainment dollar, and for the
sport fan’s attention, is increasingly intense. There was a time when baseball had the almost undivided attention
of sports fans from April to October.
Now, however, there are just six weeks between the last National
Basketball Association (NBA) championship game and the first National Football
League (NFL) preseason game. MLB must
improve its competitive balance if it is to remain competitive with other
sports attractions.”
7.
“The NFL and
NBA have thrived with structures that allow franchises in widely different
kinds of markets (including small media markets such as Green Bay and San
Antonio) to succeed. To ensure
baseball’s broad and enduring popularity, and to guarantee its future growth,
MLB needs a structure under which clubs in smaller markets can have regularly
recurring chances to contend for championships.”
8.
“MLB should
vigorously develop new ways to increase revenues, but that alone will not solve
the problem of competitive imbalance.”
9.
“The heart of
the problem is the large and growing disparity of what are called ‘local’
revenues. Although most of baseball’s
revenues are these so-called ‘local revenues,’ none of the revenues really result exclusively from the sale of a
local product. It takes two clubs to
have a game and 30 clubs to have today’s division races. All clubs are selling—indeed, all are
elements of—a single product, Major League Baseball.”
10.
“Therefore, to reform baseball’s structure to
produce reasonable competitive balance, substantially more of the industry’s
revenues should be treated as just that—the industry’s
revenues—and should be distributed in ways that cause all clubs to operate
within a much narrower band of unequal economic resources. The band should be broad enough to allow
baseball entrepreneurship to be rewarded, but narrow enough that intractable
differences between local markets do not produce a baseball underclass of
chronically uncompetitive clubs.”
11.
“The
fundamental objective of reform should be an industry in which each team’s
success on the field, over time, will be determined by the skill of the players
and the baseball acumen of the men and women who conduct the team’s
business—scouting, player development, baseball management, marketing, etc.”
12.
“Any reform of
MLB should protect and balance the interests of players, clubs and fans. These three constituencies should cooperate
to create an economic structure that promotes a reasonable rate of growth of
player salaries, produces competitive balance and preserves baseball as
affordable family entertainment.”
13.
“In recent years there has been a rapidly
accelerating disparity in revenues and, consequently, in payrolls between clubs
in high- and low-revenue markets. There
also has been a stronger correlation between club revenues/payrolls and on-field
competitiveness in the years since the issue of competitive balance was studied
by the Joint Economic Study Committee which issued its report in 1992.” (Note:
That committee was established by the 1990 Basic Agreement and included
representatives of MLB, the MLBPA and outside experts.) “The inescapable conclusion is that major
structural problems exist in the economics of professional baseball. If these flaws are not addressed by MLB
promptly, decisively, and ultimately in conjunction with the MLBPA, the future
of the game as we have known it will be imperiled.”
14.
“In short, it
should be apparent that the time for tinkering with MLB’s existing, flawed
economic structure has passed and that sweeping changes in the game’s economic
landscape are necessary. What is
required is a corrective course of action to:
1) implement reforms on matters that are not subject to collective
bargaining and that can be imposed unilaterally by the Commissioner and the
member clubs in the best interests of the game and its fans; and 2) engage the
MLBPA in cooperative and collaborative discussions, as appropriate within the
MLBPA’s collective bargaining rights, to develop and implement long-term
structural changes, strategies and joint marketing initiatives to make the game
more popular and prosperous, nationally and internationally.”
IV. Overview of Updated Data
Update—An update of the charts, tables and other
data studied by the Commissioner’s Blue Ribbon Panel to include the 2000 and
2001 seasons suggests that the economic condition of the game has not improved
significantly in the past two years, and in some ways—including industry
profitability and debt levels—may have worsened.
In their July, 2000 report, the Independent
Members wrote: “Our mission has been to
consider the relevant economic data, indicators and variables. We have concluded that a majority of MLB
clubs today are not reasonably competitive, that the problem of competitive
balance is a product of MLB’s economic structure, and that this structure is adversely
affecting the ability of most clubs to increase revenues and achieve operating
stability.”
The more recent data, extending the Blue
Ribbon Panel’s five-year view of club and industry performance to seven years,
support the view that the structural flaws the Panel identified in MLB’s economic
system remain, and the trends they foster relative to revenue and payroll
disparities, competitive imbalance and operating losses have generally
continued. The gap in both average
local revenue and average payroll between clubs in Quartile I and Quartile IV
continued to grow.
Three different teams from the bottom half
of the payroll scale have reached postseason play in the past two seasons
(including the Oakland Athletics, who have reached the playoffs both years),
and they have won a combined total of five games. In the previous five years, only one team from the bottom half of
the payroll scale reached postseason play (Houston in 1997) and did not win a
playoff game. This could be interpreted
as an improvement in competitive balance, but it is slight, and probably
aberrational. None of the Quartile III
and Quartile IV clubs advanced beyond the Division Series, and no team outside
of the top payroll quartile has won a single World Series game in the past seven
years.
The occasional low-payroll teams that do
contend for and achieve postseason berths appear to have little realistic
opportunity to retain their best players long enough, or to acquire suitable
reinforcements, to become regular contenders.
The game’s current economic system makes it problematic for many clubs
to compete for premium free agents—including players they have developed into
stars and would like to retain—or to sign the best available amateur or foreign
players. Only a few clubs have the
resources to sign the top veteran and entry-level players (including foreign
free agents).
The harsh reality facing the majority of MLB
clubs under the current economic system is that they must make a choice between
being competitive on the field or operating on a break-even or modestly profitable
basis. Only two of the 30 MLB clubs
(the New York Yankees and Cleveland Indians) have shown an operating profit
over the seven-year period, and despite generally robust revenue growth, MLB’s
industry-wide operating losses and long-term debt have reached historic levels.
Over the period 1995-2001, MLB clubs had an
average operating loss of $46 million, and the total industry operating
loss for the period was $1.4 billion.
Industry indebtedness, excluding
guaranteed player contracts for future seasons and deferred compensation, has
grown from $593 million in 1993 to $3.1 billion in 2001. Industry debt is now more than three times
the level it was in 1997.
As is usually the case with businesses that
routinely lose money, the mounting operating losses and debt levels have put
several MLB clubs at serious risk. The
inflationary pressures of trying to field a competitive team have continued to
cause a corresponding spiral in ticket and concession prices that is alarming
to heretofore loyal fans and could “price out” or reduce the frequency of
attendance by families that traditionally have been baseball’s core
audience. Meanwhile, failure to
implement an economic system that fosters a more desirable degree of competitive
balance could jeopardize the popularity and future growth of MLB, including
sustained revenue growth, as the Blue Ribbon Panel’s Report warned.
Many of the specific observations, findings
and conclusions in the Report of the Independent Members bear repeating as the
data on which they were based are updated to include the two seasons since the
Report was issued.
1. The
Blue Ribbon Panel’s Report stated: “Despite impressive industry-wide revenue
growth over the past five years, MLB has an outdated economic structure that
has created an unacceptable level of revenue disparity and competitive
imbalance over the same period. The
growing gap between the ‘have’ and the ‘have not’ clubs—which is to say the
minority that have a realistic chance of succeeding in postseason play and the
majority of clubs that have poor prospects of reaching the postseason—is a
serious and imminent threat to the popularity, health, stability and growth of
the game. Players appear to share this
view. In a survey of MLB players
published in the May 2, 2000 edition of Baseball
Weekly, lack of competitive balance was cited as the biggest problem facing
the game today. A vast majority of
players surveyed responded that it was ‘very important’ that small market teams
have the same chance of reaching the World Series as large market teams.”
Update—The positive industry revenue growth
continued in 2000, increasing 20.4 percent, which was largely attributable to a
new MLB network television contract with Fox and national cable contract with
ESPN, and the opening of new ballparks in San Francisco, Houston and
Detroit. (Seattle, which opened its new
ballpark at midseason in 1999, also had the first full year of revenues from
Safeco Field.) Revenue growth slowed to
6.7 percent in 2001, when new ballparks opened in Milwaukee and
Pittsburgh. Overall, industry revenue
has risen from $1.38 billion in 1995 to $3.55 billion in 2001, with increases
of 28.2 percent in 1996, 16.5 percent in 1997, 19.9 percent in 1998,
11.4 percent in 1999, and, as noted, 20.4 percent and 6.7 percent in 2000
and 2001, respectively. Growing
disparities in revenue and payroll between “have” and “have not” clubs
characterize the seven-year period (1995-2001) as they did the five-year period
(1995-99) examined by the Blue Ribbon Panel.
2. The
Blue Ribbon Panel’s Report stated: “The introduction of limited revenue sharing
and a ‘luxury tax’ on payrolls for a trial period under the 1996 Collective
Bargaining Agreement (known as the ‘Basic Agreement’) apparently did not create
any significant ‘drag’ on player salaries and has not significantly enhanced
competitive balance. In fact, a number
of low-revenue clubs, realizing that they had no realistic chance to compete
for the postseason, opted instead for marginal profitability from revenue
sharing proceeds and did not increase their player payrolls to levels that
would make them competitive. This grim
fact of modern baseball life has frustrated fans in low-revenue markets.”
Update—The average payroll in payroll Quartile III
has increased from $41 million in 1999 to $49.7 million in 2001, and in
payroll Quartile IV from $20.2 million in 1999 to $35.5 million in 2001,
which indicates that some low-revenue clubs have increased their payrolls in an
effort to become more competitive.
Average club payroll increased industry-wide by 17 percent in 2000 and
by 13.1 percent in 2001. Moreover,
the increase in payrolls in payroll Quartile I and Quartile II has
continued to be greater than that in payroll Quartile III and
Quartile IV. In payroll Quartile
I, the average payroll increased from $78.8 million in 1999 to $99.9 million in
2001, and in payroll Quartile II, the average payroll increased from $55.7
million in 1999 to $75.1 million in 2001.
The limited revenue sharing and luxury tax introduced in 1996 still does
not appear to have created any significant “drag” on player salaries and does
not appear to have significantly enhanced competitive balance.
3. The
Blue Ribbon Panel’s Report stated: “A reasonably level playing field, on which
clubs representing markets that are quite diverse geographically,
demographically and economically can compete with at least periodic
opportunities for success, is fundamental to MLB’s continued growth and popular
appeal. Yet, from 1995 through 1999, a total of 158 MLB postseason games were
played. During this period, no club
whose payroll fell in the lower half of the industry won even a single
postseason game. Only one has even
qualified for the postseason.”
Update—That was what George F. Will, one of the
Independent Members of the Blue Ribbon Panel, in a Newsweek column dubbed “the 158-game winning streak.” The streak was broken in 2000. The updated numbers: From 1995 through 2001, a total of 224 MLB
postseason games were played. During
this period, five clubs whose payrolls fell in the lower half of the industry
qualified for the postseason, and they won a total of five games. None advanced past the first round of the
playoffs. No team outside the top
payroll quartile has won a World Series game during the period, and only one
has reached the World Series. (The 1998
San Diego Padres, then in payroll Quartile II, won the National League pennant
but were swept in the World Series in four straight games by the New York
Yankees.) The seven-year postseason
record for 1995-2001 is 219-5 (a .978 winning percentage) in favor of the
top two payroll quartiles.
4. The
Blue Ribbon Panel’s Report stated: “MLB is now essentially divided into three
groups of unequal size: 1) clubs that
expect to reach and perform well in the postseason; 2) clubs that hope for an occasional ‘dream season’ to reach the
postseason; and 3) clubs that know going to spring training that they will not
make the playoffs.”
Update—Although some clubs have moved into higher
revenue quartiles, largely because of increased local revenues from new
ballparks, and some have increased payroll in an effort to become more
competitive, other clubs have cut payroll because of what their ownership
considers intolerable operating losses and have fallen to lower payroll quartiles. The “caste system” of clubs stratified by
revenue and payroll disparities remains essentially as described in the July,
2000 Report.
Table
1: Division Series (“DS”), League Championship
Series (“LCS”), and World Series (“WS”) Games Won by Payroll Quartile,
1995-2001
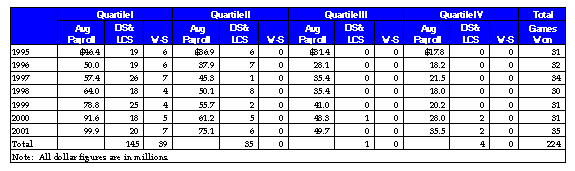
The
Blue Ribbon Panel’s Report stated: “From 1995 through 1999, a total of 158
postseason games were played. For
analytical purposes, it is useful to divide the clubs into ‘quartiles’ by
ranking them (based on payroll) from high to low and separating the clubs into
four equal size groups. For example in
1995, the seven clubs with the highest payrolls would constitute ‘Quartile
I.’ (Footnote: Prior to the expansion in 1998, each
quartile consisted of seven clubs.
After the 1998 expansion, Quartile I and Quartile III have eight clubs,
and Quartile II and Quartile IV have seven clubs.) During this five year period, no
club from payroll Quartile III or Quartile IV won a Division
Series or League Championship Series game, and no club from payroll Quartile II, Quartile III or Quartile IV won a
World Series game.”
Update—The average payroll in payroll Quartile I
has grown from $46.4 million in 1995 to $99.9 million in 2001. In payroll Quartile II, the average has
grown from $36.9 million to $75.1 million.
In payroll Quartile III, the average has grown from $31.4 million to
$49.7 million. In payroll Quartile IV,
the average has grown from $17.8 million to $35.5 million over the seven years.
The Blue Ribbon Panel
suggested that one indicator of a system that could achieve a durable
competitive balance in baseball would be a ratio of approximately 2:1 between
the average payroll of the payroll Quartile I clubs to the average payroll of
the payroll Quartile IV clubs. In
2001, the ratio was closer to 3:1. In
1999, the last season examined by the Blue Ribbon Panel, the actual gap in
average payroll between payroll Quartile I clubs ($78.8 million) and payroll
Quartile IV clubs ($20.2 million) was $58.6 million. By 2001, the actual gap had grown to $64.4 million.
As previously noted, from 1995
through 2001, a total of 224 postseason
games were played. During this
seven-year period, no club from payroll Quartile II, Quartile III or Quartile
IV won a World Series game, only one club from outside payroll Quartile I
reached the World Series, and five clubs in payroll Quartile III and
Quartile IV won a total of only five games, never advancing to the League
Championship Series.
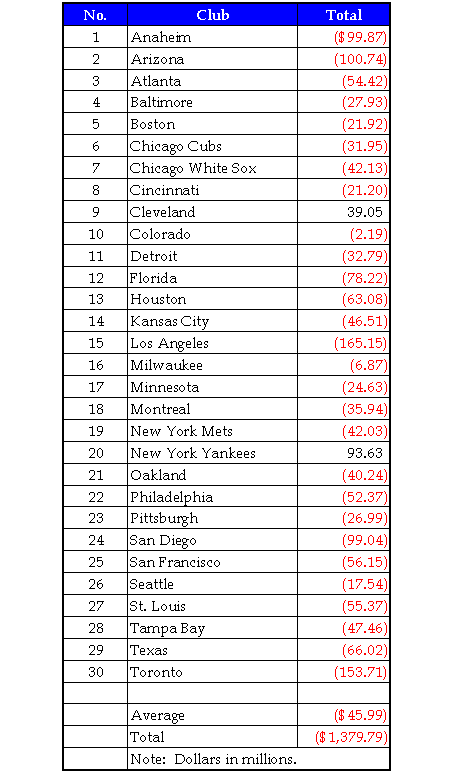
Table 2:
Industry Revenues, 1995-2001
![]()
The
Blue Ribbon Panel’s Report stated: “The years following the 1994-1995 players’
strike have seen substantially increased revenue to the industry. The average revenue of clubs in 1999
approached $100 million. Industry
revenues have doubled during the past five years . . .
“Revenue to clubs comes
primarily from three sources: 1) so-called local revenues include ticket
sales, local television, radio and cable rights, ballpark concessions, parking,
and team sponsorships; 2) Central Fund revenues are generated by
industry-wide contracts, such as national television contracts and licensing
arrangements, and historically have been distributed evenly to all clubs; and 3) revenue
sharing, introduced in 1996, which transfers locally generated money from
high-revenue clubs to low-revenue clubs.
“Revenues, in all likelihood, will continue
to grow during the next decade as new ballparks are opened. New ballparks have opened this season [2000]
in San Francisco, Houston and Detroit, and others are expected to open in 2001
in Milwaukee and Pittsburgh, and soon in San Diego and Cincinnati. Plans are moving forward for new ballparks
in other communities in the future.
“The new generation of ballparks that began
with the 1992 opening of Oriole Park at Camden Yards in Baltimore includes
design and programming features and modern amenities that have proved to be
enormously popular with the public.
These ballparks have dramatically increased the attendance and revenues
of the clubs that play in them. In
addition to Baltimore, the franchises with new ballparks that opened in the
1990s include Arizona, Atlanta, Chicago White Sox, Cleveland, Colorado, Seattle
and Texas. St. Louis and Anaheim
undertook major renovations that transformed dual-purpose stadiums (football
and baseball) into baseball-oriented facilities. New ballpark construction and renovation has made a substantial
contribution to revenue growth in the second half of the past decade.
“In fact, the construction or renovation of
facilities to add modern amenities has been effective in increasing the
revenue–and therefore the player payroll and competitiveness–of some
clubs. In many cases, the ballparks themselves
have become attractions, dramatically increasing attendance and revenues and
providing the club the financial resources to field teams with payrolls high
enough to have a chance to be competitive.
“It is reasonable to expect that new
ballparks will continue to fuel industry revenue growth for the foreseeable
future, and this is a positive trend for the industry. However, revenue growth alone does not
provide a long-term solution for the structural flaws in MLB’s economic system. Eventually, most clubs will have attractive,
baseball-oriented facilities with modern amenities, and then the
revenue/payroll disparities that breed competitive imbalance will be magnified
because the clubs in large media markets have revenue opportunities from new
ballparks that are greater than those of their counterparts in smaller
markets. They can command more for
naming rights, ballpark signage, team sponsorships, etc. They can charge more for tickets, sell more
suites and club seats than their small market competitors, as well as receive
substantially more for local television and radio rights. The level of public investment in new
ballparks also varies dramatically from community to community, which means
that some clubs need to devote much more of their newly generated revenue to
private financing and debt service than others.
“New ballparks are vitally important for
expanding the game’s prosperity.
Baseball is best enjoyed in intimate, charming venues that become
attractions in themselves and enhance the entertainment experience, regardless
of whether the home team is winning or losing.
However, they are not in and of themselves the answer to solving the
competitive balance and economic problems that plague MLB.”
Update—As previously noted, industry revenue
growth slowed dramatically in 2001 from the robust levels of the previous six
years, increasing 6.7 percent from the prior year, compared to increases of
28.2 percent in 1996, 16.5 percent in 1997, 19.9 percent in 1998, 11.4. percent
in 1999, and 20.4 percent in 2001.
Without new ballparks that opened in Milwaukee and Pittsburgh, 2001
growth was only 5.5 percent. Moreover,
the projected outlook for revenue growth in 2002 has been revised downward
because no new ballparks will open and the continuing national economic
slowdown, exacerbated by the events of September 11, 2001, has caused a
downturn in corporate spending. As
noted in the Blue Ribbon Panel’s Report, new ballparks that enhance the
entertainment experience of baseball, with modern amenities and premium
seating, are important to the industry and to future revenue growth, but they
should not be viewed as a panacea for MLB’s economic and competitive balance
problems.
Table
3: Local Revenue Growth, 1995-2001

The
Blue Ribbon Panel’s Report stated: “Local revenue grew 87 percent from 1995 to
1999, adding some one billion dollars (or roughly $200 million each year) to
the industry’s total revenues. From
1996 through 1999, local revenue constituted approximately 79 percent of total
industry revenue. (Footnote: In 1995, during a strike-shortened season,
local revenues comprised approximately 84 percent of industry revenues.)”
Update—Local revenue grew 141 percent from 1995 to
2001, adding some $1.6 billion (or roughly $275 million each year) to the
industry’s total revenues. From 1996
through 2001, local revenue constituted approximately 78 percent of total
industry revenue.
The
Blue Ribbon Panel’s Report stated: “In 1999, the range of local revenues was
enormous, from $12 million for Montreal to $176 million for the New York
Yankees. This begs the obvious
question: How can a club like Montreal
expect to compete with the New York Mets, whose local revenues are ten times
greater? The inescapable answer
is: They cannot, even with a productive
scouting and player development system and sound baseball management. Several low-revenue clubs in the 1990s have
tried to remain competitive on the field with a strategy of devoting their
modest resources to scouting and player development and fielding teams of
young, talented players who likely would have had more minor-league seasoning
with higher-revenue, higher-payroll clubs.
The theory under which these lower-revenue clubs have operated is that
their fans would appreciate seeing young, aggressive, ‘hungry and hustling’
teams and that they would be able to retain a nucleus of these young stars long
enough to contend periodically for the postseason. Unfortunately, doing so has become increasingly problematic, and
fans in those markets have become progressively frustrated, disillusioned and
resigned to also-ran status as a seemingly endless succession of home-grown
talent has moved on, via free agency or financially motivated trades, to help
high-revenue, high-payroll clubs to championships.”
Update—In 2001, the range of local revenues was
even more enormous, from $9.8 million for Montreal to $217.8 million
for the Yankees, which meant that many clubs could not realistically compete
with league and division rivals whose local revenues (and payrolls) are
multiples more. An outstanding recent
example of a low-revenue club remaining competitive through sound baseball
management, including scouting and development, is the Oakland Athletics, who
are in revenue Quartile IV and payroll Quartile IV, but have made it to the
playoffs the past two seasons, winning two games each time in the best-of-five
Division Series before falling to the Yankees.
Chart
2: Average Local Revenue by Club,
1995-2001
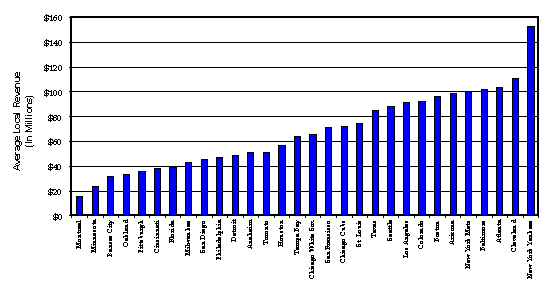
The
Blue Ribbon Panel’s Report stated,
referring to the comparable chart for the period 1995-1999: “The graphic depiction of the problem
illustrates just how steep a mountain the low-revenue clubs have to climb.”
Update—The mountain is still steep for the low
revenue clubs. The average local
revenue for the clubs at the high end of the graph has grown at a faster rate
than the average local revenues of the clubs at the low end of the graph.
The
Blue Ribbon Panel’s Report stated:
“Local revenues generally are the largest component of most clubs’ annual
revenue. Unlike other professional
sports, in which a much larger portion of television rights fees are pooled and
distributed equally among all teams, most MLB television and radio rights are
negotiated and sold locally, in each individual market. Only the rights to network television and
radio (essentially rights to postseason games) and a national cable package are
sold by MLB, with the revenue going to the Central Fund. Because local markets vary greatly in size,
the local TV and radio revenues flowing to each club vary in size by large amounts. The local radio and TV rights received by
some clubs exceed the total revenues of other clubs.
“Media market rank also affects other local
revenues available to clubs, including the amount they can charge for ballpark
naming rights, signage, sponsorships, etc.
No matter how well-managed a club might be, it cannot change its media
market rank – a factor in the revenue disparity that translates to payroll
disparity and competitive imbalance.”
Update—This has not changed.
Chart
3: Average Local Revenue by Revenue
Quartile, 1995-2001
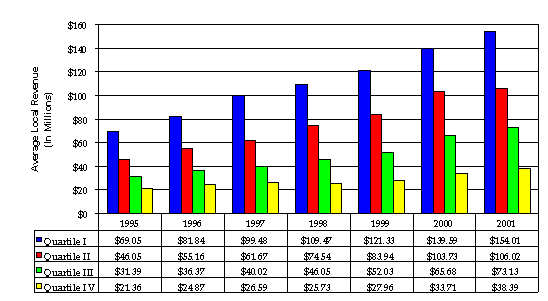
The
Blue Ribbon Panel’s Report stated: “The disparity in local revenues also can be
examined by considering all clubs in their respective revenue quartiles, where
Quartile I contains the highest revenue clubs and Quartile IV contains the
lowest revenue clubs.
“Over the period 1995 to 1999, average local
revenue (i.e., ticket sales,
concessions, local and television and radio, sponsorships, etc.) has increased
by $53.5 million for revenue Quartile I clubs, but has increased only an
average of $7.9 million for revenue Quartile IV clubs. Revenue Quartile I, Quartile II and Quartile
III all had regular increases during the five-year period, as shown below. The average for revenue Quartile IV has not
shown a consistent increase. (The
average declined from 1997 to 1998.)
The seemingly unbridgeable—and ultimately unacceptable—chasm between the
‘haves’ and the ‘have- nots’ has grown wider.”
Update—Over the period 1995 to 2001, average local
revenue has increased by $84.96 million for revenue Quartile I clubs, but has
increased only by $17.03 million for revenue Quartile IV clubs. The chasm between the “haves” and the “have
nots” continues to grow wider.
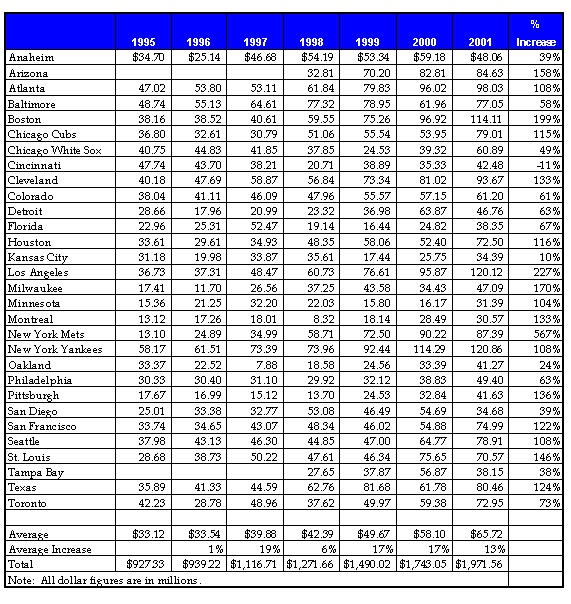
Table
6: Average Annual Net Central Fund
Distribution, 1995-2001
![]()
The
Blue Ribbon Panel’s Report stated: “Central Fund revenue historically has been
distributed equally to all clubs. The
table [above] shows the amount of the annual allocation. (Footnote: Net Central Fund distributions
may vary slightly—less than 5 percent—from the table to reflect certain
financial arrangements, including those for new franchises entering MLB; however, in 1998 and 1999, Arizona and Tampa
Bay, as new franchises, received approximately 42 percent and 53 percent of the
Central Fund Distribution made to the other 28 clubs.)
“Central Fund distributions have risen each
year, but not as fast as the local revenues of some of the highest revenue
clubs. The lowest revenue clubs,
however, find that their Central Fund distribution is now larger than their
local revenues.
“In addition to the central revenues that
are shared equally by the clubs through the Central Fund, MLB has, since 1996,
redistributed local revenues centrally through the mechanism contained in
Article XXV of the Basic Agreement.
Over this four-year period through the 2001 season, the higher revenue
clubs have redistributed a total of $312 million to lower revenue clubs. Accordingly, in addition to the Central Fund
payments a club receives, each club’s total revenue figures reflect the club’s
revenue sharing (payments) or receipts.”
Update—The average annual net Central Fund
distribution had its largest increase in the seven-year period in 2000, from
$13,419,062 in 1999 to $18,186,432.
This was in part because of a new network television contract with Fox
and a new national cable television package with ESPN. For the first time in the seven-year period,
the average annual net Central Fund distribution declined in 2001 from the
previous year, to $17,856,000.
Table
7: Average Club Payroll, 1995-2001

The
Blue Ribbon Panel’s Report stated: “Quite simply, the higher revenue clubs have
the financial resources to: 1) sign
high-salaried free agents from other clubs;
2) retain their own high-salaried players; and 3) sign top prospects
from the Rule 4 draft, where signing bonuses for highly sought-after players
have risen dramatically in recent years, and players from foreign countries,
where players are exempt from the draft and can be signed as free agents. The rich clubs become richer in talent,
stockpiling expensive players, while poor teams cannot afford to bid on premium
players either at the entry level or on the veteran free agent market.”
Update—The average club payroll has continued to
rise, increasing 17 percent in 2000 and 13.1 percent in 2001. The average club payroll increased by
50 percent for the five-year period, 1995-1999. That increase was 98.4 percent for the seven-year period,
1995-2001.
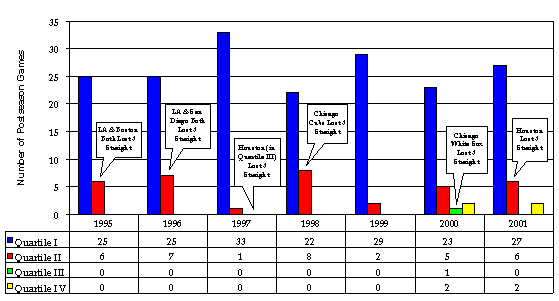
The
Blue Ribbon Panel’s Report stated: “The stratification of clubs in different
payroll quartiles into consistent contenders, occasional contenders and
hopeless pretenders is also reflected when the results of postseason games are
analyzed.
“From 1995 through 1999, a total of 158
postseason games were played. During
this five-year period, no club from payroll Quartile III or Quartile IV won a
postseason game. Further, only one club from payroll Quartile III appeared in
the postseason during this period.”
Update—Teams from payroll Quartile III and
Quartile IV have reached the postseason four times in 2000 and 2001, and once
in 1995-1999, winning a total of five games.
None has advanced beyond the Division Series. For the seven-year period 1995-2001, teams from payroll Quartile
III and Quartile IV have won only 2.2 percent of all postseason games (five of
224).
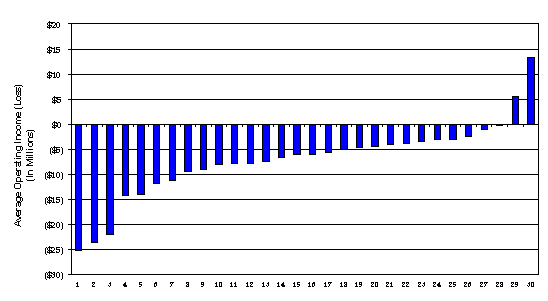
Chart
1: Average Annual Operating Income for
All Clubs, 1995-2001
The
Blue Ribbon Panel’s Report stated:
“From 1995 through 1999, only three clubs achieved profitability: Cleveland, Colorado and the New York
Yankees.”
Update—For the seven-year period from 1995 through
2001, only two clubs achieved profitability:
Cleveland and the New York Yankees.
Chart
14: MLB Total Revenue and Operating
Loss, 1995-2001
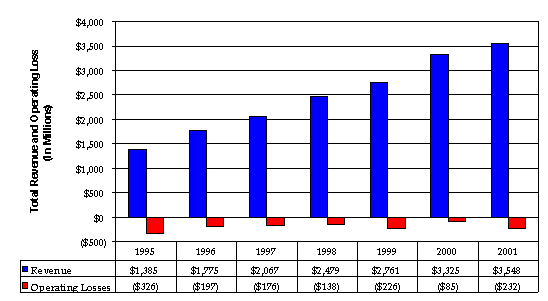
The
Blue Ribbon Panel’s Report stated:
“Industry revenue has grown impressively in the past five years. Operating income, however, has been another
story. While revenue growth has been
steady, operating losses improved only slightly from those sustained in 1995,
and remain large. The total MLB losses
for the past five years exceed $1 billion.”
Update—Industry revenue continued to grow in 2000
and 2001 – as previously noted, by 20.4 percent in 2000 and 6.7 percent in
2001. Operating income continues to be
a different story. Total MLB operating
losses in 2000, when new network and national cable TV contracts went into
effect, new ballparks opened in three cities (San Francisco, Houston, Detroit)
and Seattle played its first full season in its new ballpark, were $85 million,
the lowest in the seven-year period.
Operating losses in 2001 are $232 million, the most since 1995. Total MLB operating losses for the past
seven years exceed $1.38 billion.
Chart 17: Industry Debt, 1993-2001
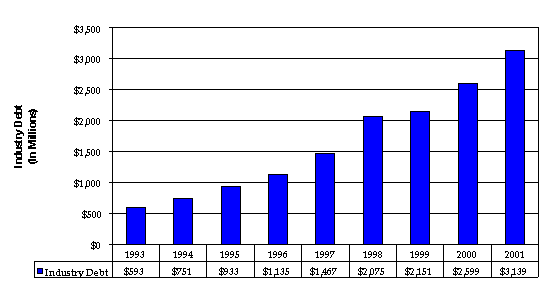
The Blue Ribbon Panel’s Report
stated: “Total industry
debt (which includes long-term debt, notes payable and revolving credit) has
risen 243 percent from 1993 through 1999, the last year for which information
was available. The average club debt in
1999 was approximately $69 million, and undoubtedly will continue to rise. Corporate debt has to be serviced, and will
exert pressure on club economics. Many
clubs have reached dangerous levels of debt.”
Update—Total industry debt has risen from $593
million in 1993 to 3.14 billion in 2001 (429 percent). The average club debt in 2001 is approximately
$105 million. (This excludes deferred compensation. Deferred compensation commitments in 2001
total an additional $1.11 billion, with eight clubs that have commitments
exceeding $60 million. Deferred compensation
has increased by more than 300 percent since 1995.)
VI.
Appendix A
Detailed Data on Local Revenue, Total Revenue
and Payroll by Club, 1995-2001
Appendix
III to the Blue Ribbon Panel’s Report included detailed information on local
revenue, total revenue, and payroll by club for the period 1995-1999. This information has been updated to include
2000 and 2001 in the following tables.
Table 27: Local Revenues by Club, 1995-2001
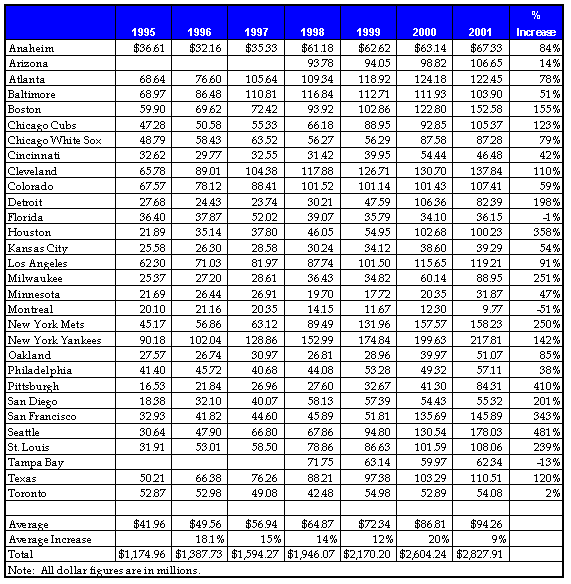
Table 28: Total Revenue by Club, After Revenue
Sharing, 1995-2001
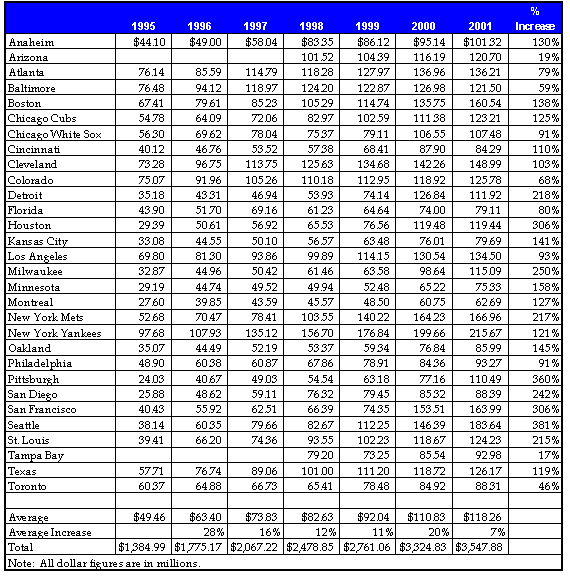
Table 29: Payroll by Club (25-Man Roster), 1995-2001
VII. Appendix B
1.
Revenue
a.
Local revenue
consists of gate receipts, local television, radio and cable rights fees,
ballpark concessions, local advertising, sponsorship and publications, parking,
suite rentals and postseason and spring training revenues. Local revenues are the largest single
component of most clubs’ total annual revenues.
b.
Central Fund
revenue is the money distributed to clubs from national licensing fees and
television/radio contracts.
c.
Revenue
sharing receipts/payments, introduced in 1996, are local revenues transferred
by formula from high-revenue clubs to low-revenue clubs.
2.
Payroll
a.
Payroll is
calculated from the active 25-man roster (including players on the disabled
lists) as of August 31 each year and termination pay where applicable.
b.
The MLB Labor
Relations Department defines the 25-man roster payrolls to include guaranteed
base salary, earned incentives and a pro-rated allocation of signing bonuses.
3.
Revenue and Payroll Quartiles
a.
For the
purposes of the Blue Ribbon Panel Report, and this update, clubs were divided
into four quartiles based on revenue and payroll. Revenue Quartile I clubs had the greatest revenue, while Quartile
IV clubs had the lowest. Similarly,
payroll Quartile I clubs were those with the largest player payrolls, while
Quartile IV clubs were those with the smallest payrolls.
b.
Prior to
expansion in 1998, each quartile consisted of seven clubs. After the 1998 expansion, Quartile I and
Quartile III have eight clubs and Quartile II and Quartile IV have seven clubs.